On July 1, the regulations implementing the California Consumer Privacy Act required companies that process large volumes of data about Californians to publicly post metrics regarding data subject requests. While many companies have processed DSRs for years under the EU General Data Protection Regulation and the Privacy Directive that preceded it, the CCPA is the first law that requires companies to publicly disclose information about their DSR process. It provides a unique and unparalleled opportunity for benchmarking between industries and between companies in the same industry. We reviewed every Fortune 500 company that published DSR metrics to help companies evaluate their own DSR experience with the benefit of industry benchmarking.
The CCPA DSR metrics reporting requirement
One of the most notable aspects of the CCPA is that it was the first U.S. statute to generally confer upon California residents the (1) right to know what personal information a business collects about them, (2) the right to request businesses delete their personal information, and (3) a right to opt out of the sale of their personal information if such information is being sold. Additionally, the California attorney general enacted a regulation requiring companies that bought, received, sold or shared for commercial purposes the personal information of 10 million or more California residents in a calendar year publicly disclose DSR metrics in their privacy notices by July 1. Specifically, they are required to disclose the number of access requests, deletion requests and "Do Not Sell" requests the business received, complied with in whole or in part, or denied as well as the median or mean number of days within which the business substantively responded to those requests.
The Fortune 500
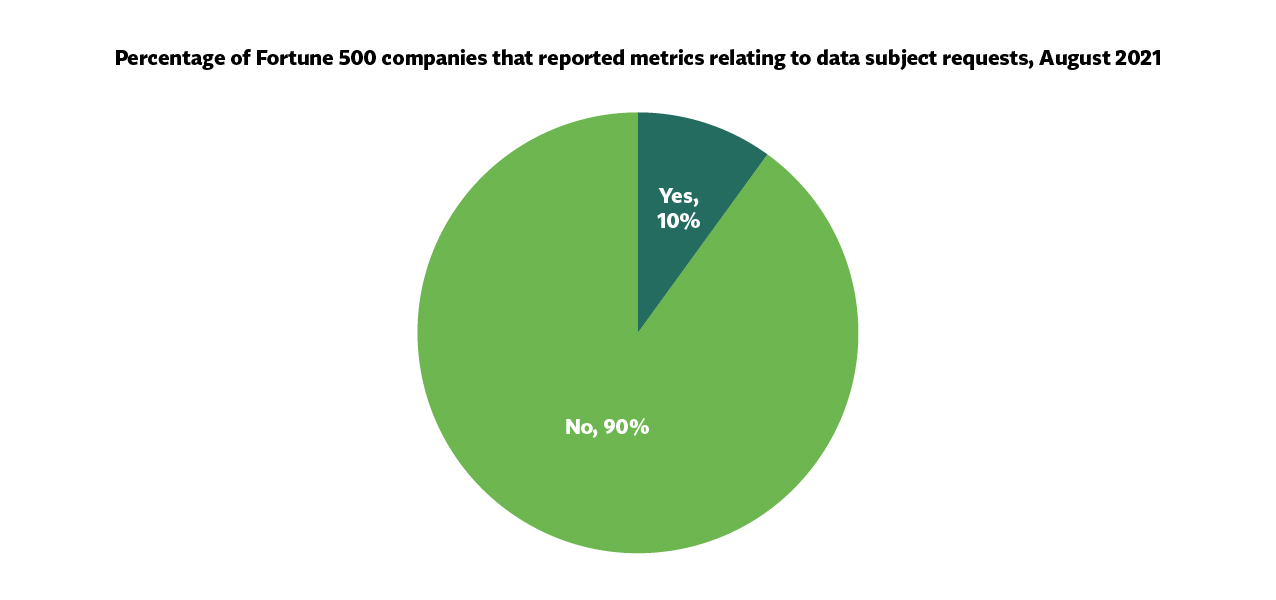
We reviewed the privacy notices of all companies within the Fortune 500 to identify DSR metrics; what we found might surprise readers. Only 52 Fortune 500 companies (approximately one in 10) disclosed metrics, thereby suggesting only 10% of the Fortune 500 maintain data about more than ten million Californians. The primary industries that met the threshold include somewhat obvious examples, such as technology, banking and retail, but also unexpected ones, such as some insurance companies.
Collectively, the companies reported 4.7 million access requests, 4.3 million deletion requests and 1.6 million DNS requests. The overall statistics, however, hide the disparate impact of DSRs on certain companies and sectors. Indeed, just one company received more access requests (2,951,350) than the other 51 companies combined.
While the following sections discuss statistics and trends by industry, there are inherent limitations on the sample size as well as potential inconsistencies across companies’ metrics calculations, i.e., what requests are in scope, data set scope, i.e., only Californians or all requestors, response timing, i.e., average versus median days to respond, and definition of denial for reporting purposes.
Weeding out the technology tranche
A handful of companies in the technology or online retail sector accounted for over 90% of the total requests and 99% of the access and deletion requests. The true outlier from the data was one large tech company that accounted for 64% of the total requests received by all reporting companies.
Despite their high overall volume of DSRs, it is interesting to note that as a group they received relatively few DNS requests. Their ratio of access requests to DNS requests was also significantly different to the ratios observed in other industries. This disparity may owe, in part, to the fact that the vast majority (66%) of tech companies that reported DSR metrics did not have a Do Not Sell My Personal Information link on their homepage and thus did not accept DNS opt-out requests altogether.
While the data in the technology-focused sectors is interesting in its own right, because of its unique volume we have separately reported statistics here and have excluded the data as outliers when examining overall trends.
Access requests
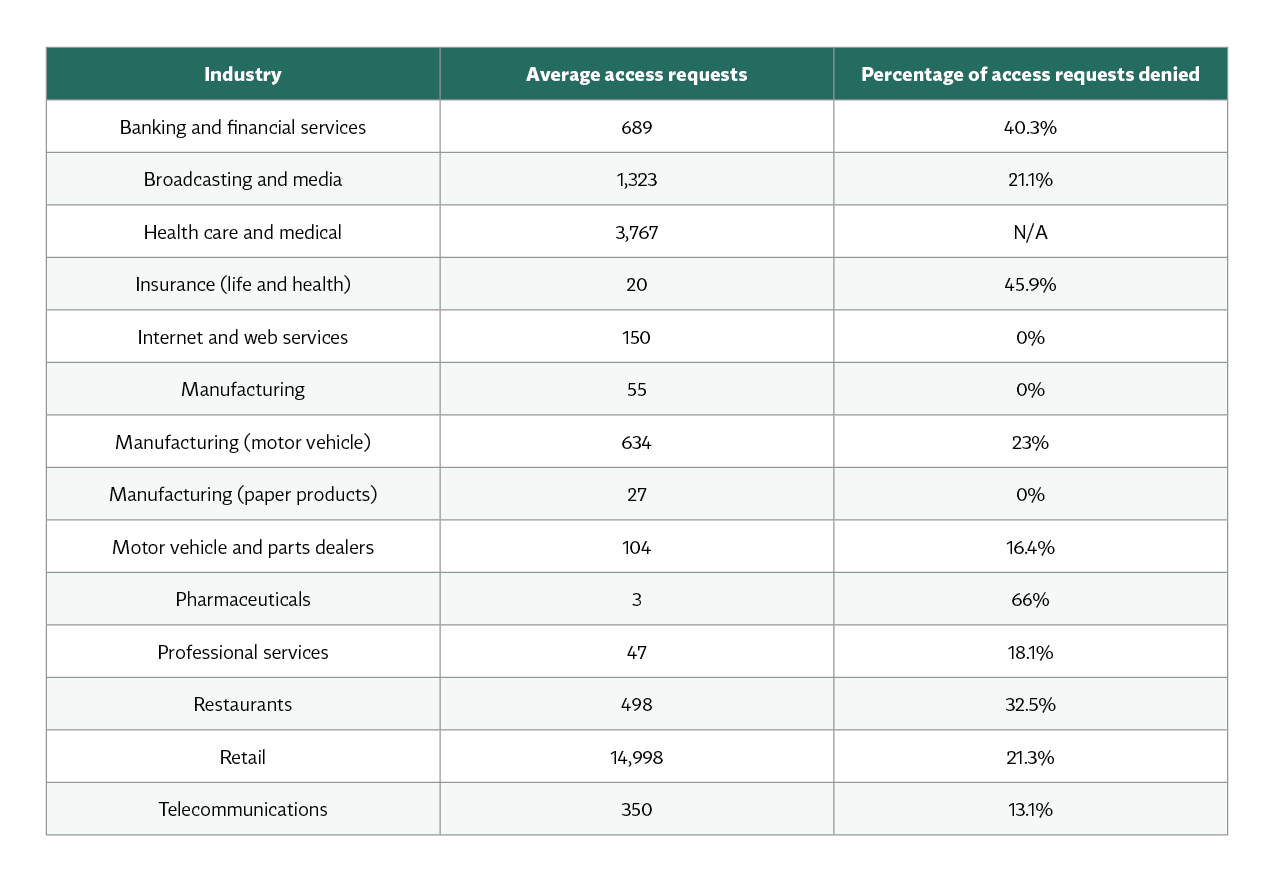
Among the non-tech industries, retailers reported the largest quantity of access requests with an average of 14,998 requests per company. That average, however, was significantly skewed by three retailers that respectively received 100,960, 73,810 and 47,445 requests. When those outliers were removed, the remaining 12 Fortune 500 retailers averaged only 230 requests per company. The following is a breakdown of the average requests by industry:
Deletion requests
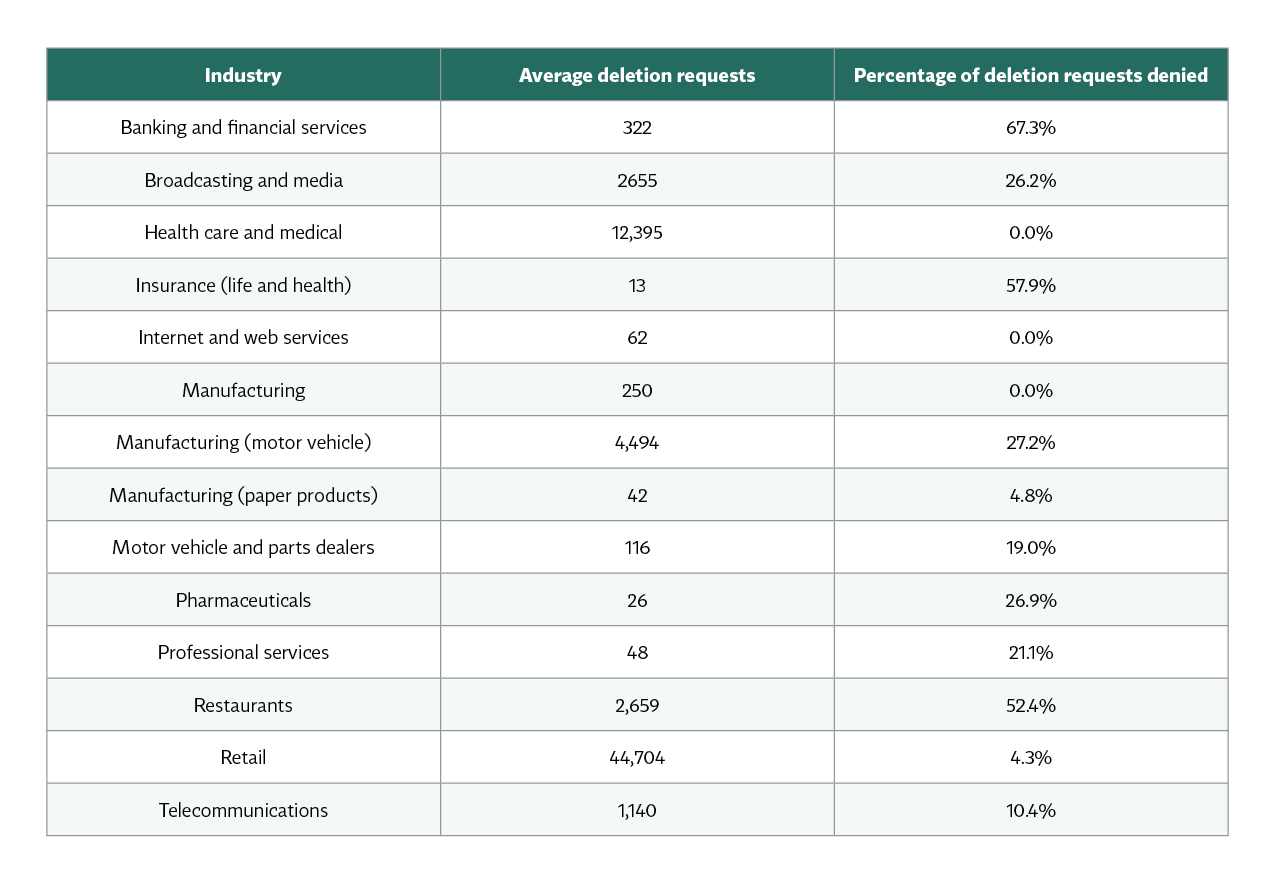
Among the non-tech industries, retailers also reported the greatest number of deletion requests. As with access requests, the same three companies skewed the overall average of 44,704 requests. When those companies were removed as outliers, the remaining 12 Fortune 500 retailers received, on average, 482 requests. The following is a breakdown of the average deletion requests by industry:
DNS requests
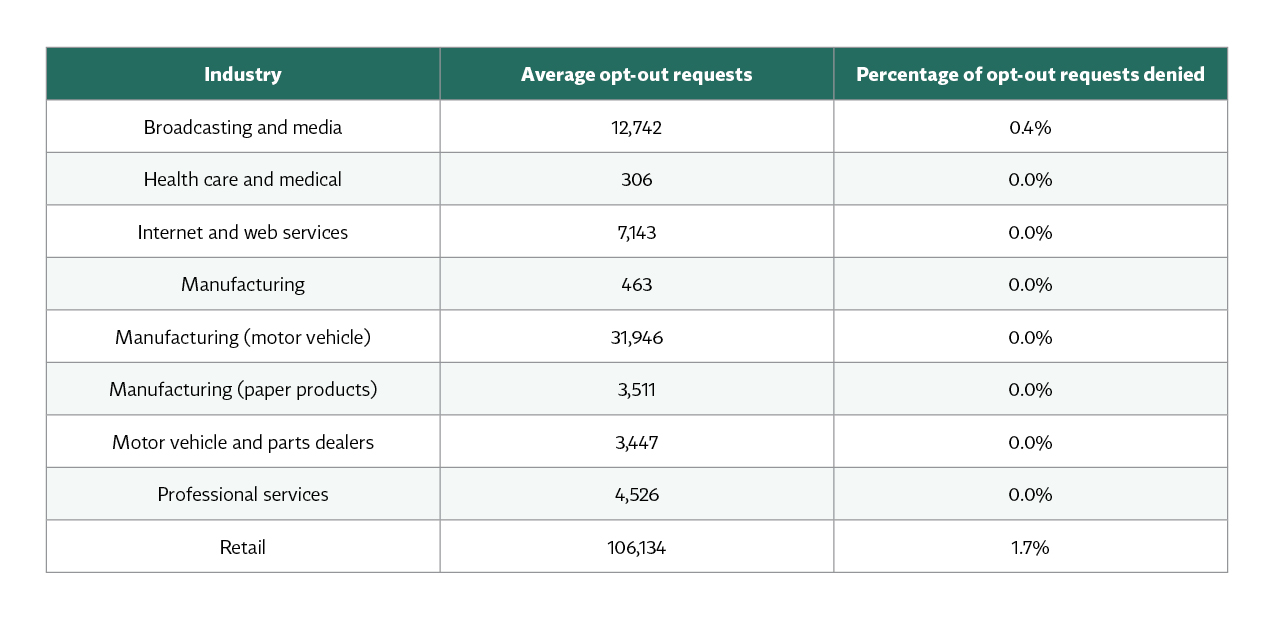
While DNS requests had a negligible impact on the tech companies that accounted for the majority of DSRs, among non-tech companies, DNS requests vastly exceeded other requests, representing over 64% of the total request volume. Among companies that sold data and offered a DNS option, the average quantity of DNS requests received was 52,500.
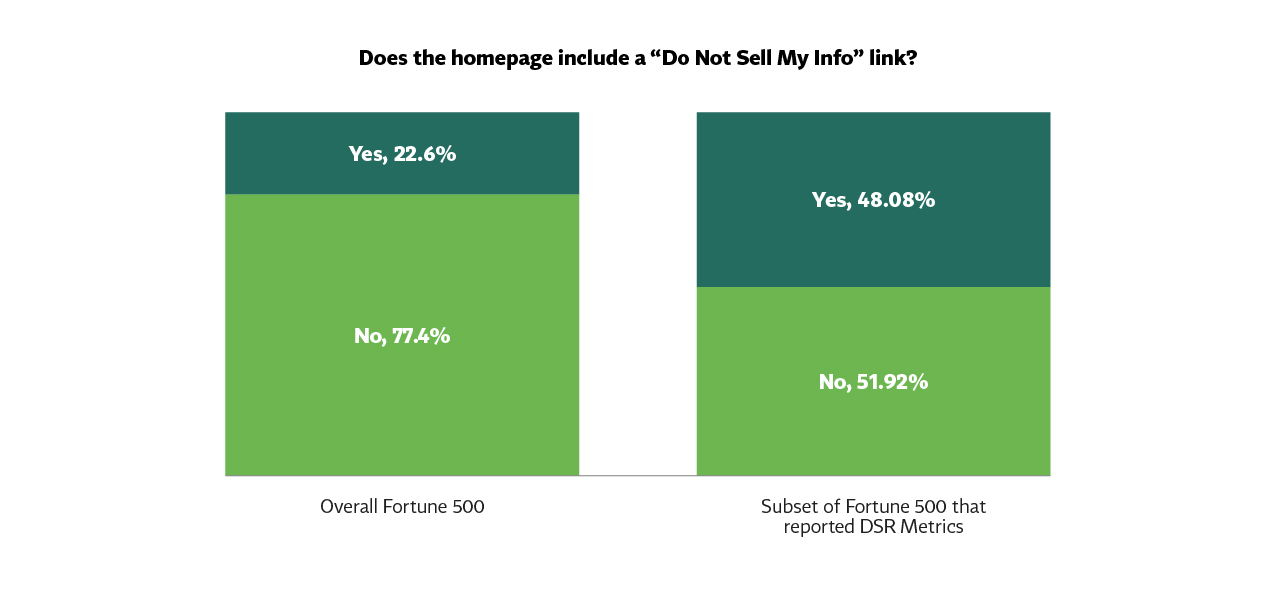
Of course, not every company sells data or offers a DNS option. Indeed, most of the Fortune 500 (77.4%) do not offer a DNS link or a DNS option. However, companies that reported DSR metrics were almost twice as likely to offer a DNS option than companies that did not report metrics:
The following provides a breakdown of the average DNS requests received by industry (including only those companies that provided DNS links on their homepage):
Data request
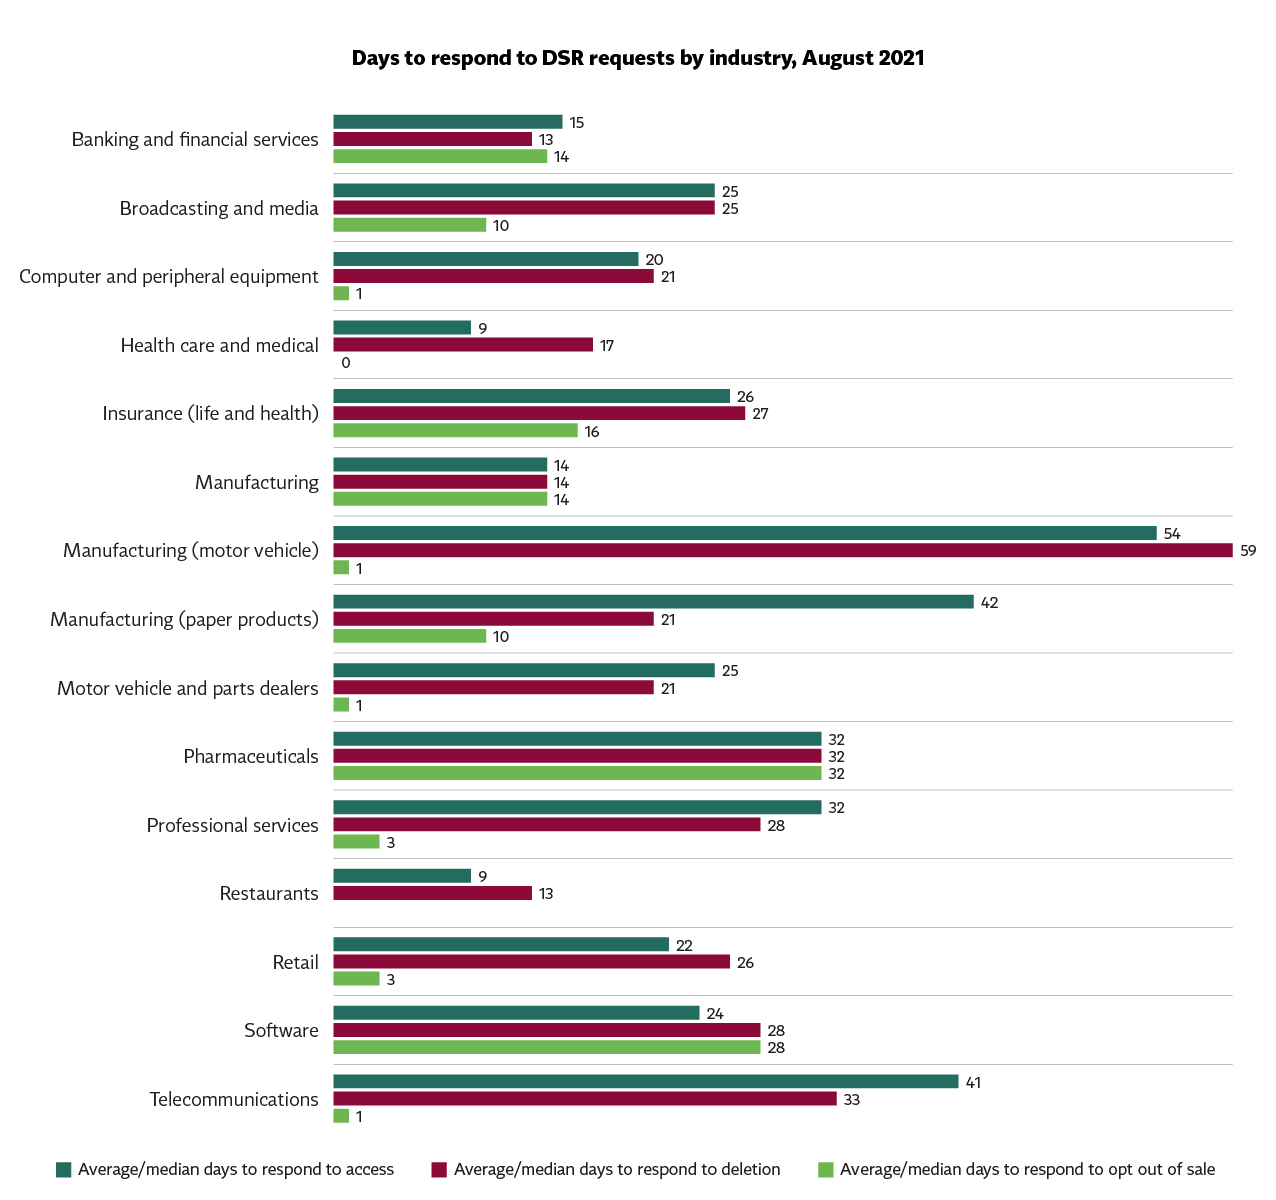
How quickly companies responded to DSRs varied greatly. Some companies were able to address requests in a handful of days, while many others took over a month (or exceeded the initial 45 days permitted by the CCPA). Overall, companies reported an average/median of 22 days to respond to access and deletion requests, and six days to respond to DNS requests.
Lessons learned
While making conclusions from the data is difficult given the small sample size, data privacy officers should consider the following five high-level takeaways:
- Plan for the future. Companies want to know what their future request profile will look like to plan for potential increases in request volume. While the best predictor is the company’s own request metrics, the data provides helpful snapshots for potential future request ranges and consumers’ experience and expectations regarding response time periods.
- Expect request volumes to grow. The publicly reported request volumes reflect the first year of the first comprehensive state privacy law in the United States. As privacy awareness builds, more states enact privacy laws, and “authorized agents” or DSR aggregators become more active, the volume of requests will likely increase for most companies.
- Be wary of data manipulation. Some commentators have published statistics regarding DSR requests based on small sample sizes or hand-picked companies. Those statistics are susceptible to selection bias, but, more importantly, appear to fail to account for a handful of companies that receive a significant number of DSRs, thereby skewing the data. The net result is that we observed some commentators reported statistics being as much as 21 times greater than what the data shows when outliers are removed.
- Exemptions influence behavior. Perhaps not surprisingly, the percentage of requests denied tend to be significantly greater in industries exempt from the CCPA, e.g., those regulated by the Gramm-Leach-Bliley Act or the Health Insurance Portability and Accountability Act. Presumably, the denial rate reflects the practice of exempt entities denying, in part or in whole, requests they are not required to comply with.
- No industry or sector standard has emerged. There is more divergence than convergence in DSR behavior between industries regarding the volume of DSRs submitted, the acceptance/denial rate of industry members and the speed of DSR response. Within those industry sectors for which there were a sufficient number of companies reporting to draw intra-industry comparisons, it is also apparent there is currently no industry standard.
Photo by Adam Nowakowski on Unsplash

