Using data from the IAPP’s 2011 Global Survey, which queried data protection authorities about staff size and budget, and the ICDPPC Census 2017, which asked similar questions (see sidebar), the IAPP has been able to analyze changes in income and staff levels within a sample of national data protection authorities.
As you'll see detailed below, within the sample overall, total DPA income declined by about 3.5 percent, from about $8.5 million per DPA in 2011, to about $8.2 million per DPA in 2016. Although more DPAs reported a gain in income than reported a loss over the five-year period, the losses outweighed the gains. While the average rise in DPA income was about $1.9 million, the average decline in DPA income was about $3 million. In absolute terms, Mexico’s INAI saw the biggest gain in its income, with an increase from $39 to $53 million during 2011-2016. (However, the Mexican DPA has reorganized in the interim; it used to be the Federal Institute for Access to Information and Data Protection, then known as the IFAI.) Relatively speaking, however, the largest income growth was experienced by Ireland’s Data Protection Commissioner, whose income went from $1.7 to $5.6 million, an increase of about 227 percent. The largest income decline in absolute terms was experienced by Italy’s Data Protection Authority, whose income went from $35 to $24 million. However, the largest relative five-year decline in income was experienced by Cyprus’s Office of the Commissioner for Personal Data Protection, which went from $426,000 to $238,000, marking a reduction of about 44 percent.
Meanwhile, DPAs employed an average of 69 full-time employees (FTEs) in 2011. By 2016, this had increased to an average of 97 FTEs per DPA. Thus, DPAs around the globe added an average of about 28 FTEs, or grew the size of their payrolls by about 41 percent, over the five-year period. Of course, excluding one outlier, Mexico’s INAI, which hired 461 staff between 2011 and 2016, produces a picture that is slightly different but more indicative of the rest of the sample. Without Mexico, DPAs had an average of 62 FTEs in 2011 and 75 FTEs in 2016, and the total number of DPA staff grew by about 20 percent over the five-year period. In other words, national DPAs added an average of 12 FTEs to their payrolls between 2011 and 2016.

Twenty-two DPAs saw a net increase in their number of FTEs, two (Australia and Lithuania) saw no change, and only four (Spain, Greece, Cyprus, and Slovenia) experienced a decline in their number of staff. The largest staff cut was 16 FTEs in Spain, while the largest absolute gain in the number of staff was at Mexico’s INAI, which increased its payrolls from 248 to 709 FTEs, growing at a rate of 186 percent. Relatively speaking, Ireland’s DPC, which went from 22 to 64 FTEs, had the highest rate of staff growth, at about 191 percent.
The most typical story of a DPA over the past five years is perhaps the following: Seeing a modest rise in income combined with a modest rise in staff.
The 'Negative' News First: Total DPA Income Declined from 2011 to 2016
Across the 27 DPAs included in both the IAPP’s 2011 Global Survey and the ICDPPC Census 2017, total DPA income declined from 2011 to 2016. The average DPA income was $8.5 million in 2011. In 2016, however, it was $8.2 million. Thus, on the one hand, DPA incomes decreased by an average of about $300,000, or about 3.5 percent, during the five-year period.
On the other hand, the number of DPAs reporting a gain in income from 2011 to 2016 outnumbered the DPAs reporting a loss in income. While 15 saw a rise in their incomes, only 12 experienced a reduction. However, the magnitude of all DPA income losses exceeded the magnitude of all DPA income gains. While the average rise in DPA income was about $1.9 million, the average decline in DPA income was about $3 million.
These averages, however, gloss over the differences in income and staff levels experienced from one DPA to the next. The following sections provide a more nuanced picture of changes in income and staffing at DPAs around the world from 2011 to 2016.
Which DPAs Saw the Biggest Income Gains from 2011 to 2016?
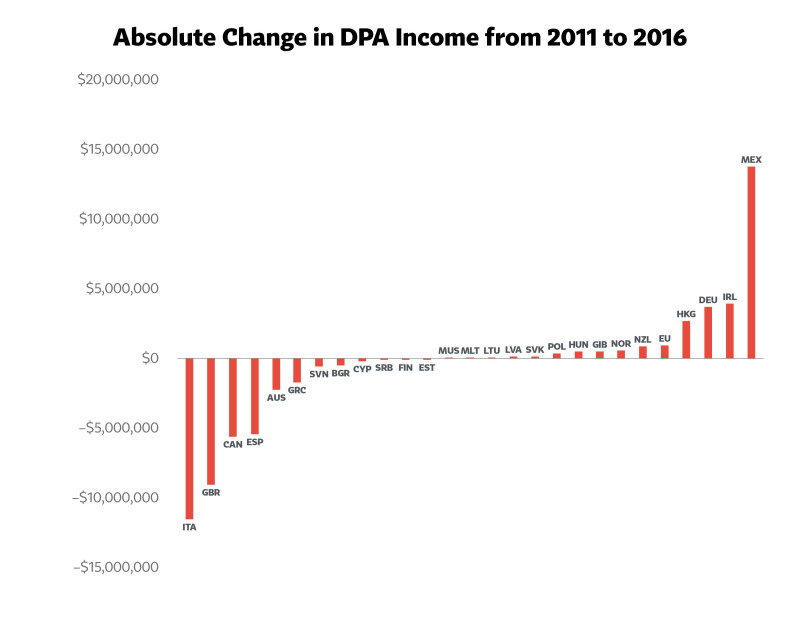
In absolute terms, the largest increase in income over the five-year period was experienced by Mexico’s National Institute for Transparency, Access to Information and Personal Data Protection (INAI), whose income rose to $53 million from $39 million. Increases of more than $1 million over the period were also experienced by the following DPAs: Ireland’s Data Protection Commissioner ($3.9 million increase), Germany’ Federal Commissioner for Data Protection and Freedom of Information ($3.7 million increase), and the Privacy Commissioner for Personal Data, Hong Kong ($2.7 million increase). Lastly, increases of $1 million or less were reported by the following DPAs: New Zealand’s Privacy Commissioner ($895,000), the Norwegian Data Protection Authority ($625,000), the Gibraltar Regulatory Authority ($530,000), the Hungarian National Authority for Data Protection and Freedom of Information ($492,000), Poland’s Bureau of the Inspector General for Personal Data Protection ($413,000), the Office for Personal Data Protection of the Slovak Republic ($195,000), the Data State Inspectorate of the Republic of Latvia ($179,000), Lithuania’s State Data Protection Inspectorate ($67,000), Malta’s Information and Data Protection Commissioner ($46,000), and the Data Protection Office of the Republic of Mauritius ($7,348).
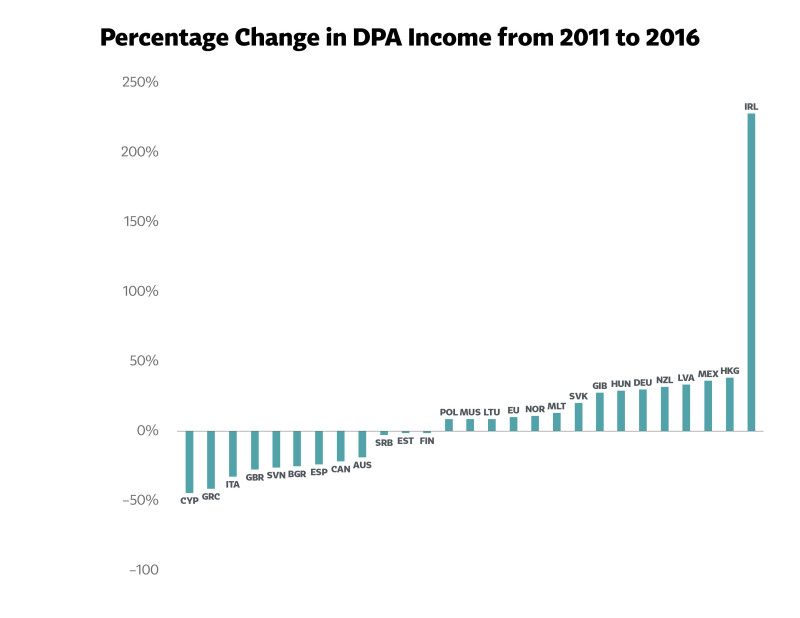
In relative terms, however, the largest increase in income over this five-year period by far was experienced by Ireland’s Data Protection Commissioner. From 2011 to 2016, its income went from $1.7 million to $5.6 million, an increase of about 227 percent. Other DPAs that reported a double-digit percentage increase in their incomes include: Hong Kong (up 38 percent), Mexico (up 35 percent), Latvia (up 33 percent), New Zealand (up 31 percent), Germany (up 29 percent), Hungary (up 28 percent), Gibraltar (up 27 percent), Slovakia (up 20 percent), Malta (up 13 percent), and Norway (up 11 percent).
Amongst all DPAs whose incomes increased over the five-year period, the average rise was 35 percent (excluding Ireland, a major outlier, it was 21 percent).
Which DPAs Felt the Biggest Income Cuts from 2011 to 2016?
In absolute terms, the largest five-year income decline was experienced by Italy’s DPA (Garante per la protezione dei dati personali), whose income went from $35 million to $24 million. Other DPAs that experienced a decrease in income over the period of more than $1 million include: Australia’s Office of the Australian Information Commissioner ($9.4 million decrease), the United Kingdom’s Information Commissioner’s Office ($9 million decrease), Canada’s Office of the Privacy Commissioner of Canada ($5.5 million decrease), Spain’s Data Protection Agency (AEPD) ($5.4 million decrease), and the Hellenic Data Protection Authority ($1.7 million decrease). Decreases of $1 million or less were experienced by the following DPAs: Slovenia’s Information Commissioner (Informacijski pooblascenec) ($560,000 decrease), Bulgaria’s Commission for Personal Data Protection ($476,000), Cyprus’s Office of the Commissioner for Personal Data Protection ($188,000), Serbia’s Commissioner for Information of Public Importance and Personal Data Protection ($52,000), Finland’s Office of the Dataprotection Ombudsman ($33,000), and the Estonian Data Protection Inspectorate ($16,000).
As a percentage of their 2011 income, however, the largest relative decline in income over the five-year period was experienced by Cyprus’s Office of the Commissioner for Personal Data Protection. Its income went from $426,000 in 2011 to $238,000 in 2016, marking a reduction of about 44 percent. Meanwhile, the Hellenic Data Protection Authority saw its income reduced by 41 percent, and Italy’s DPA saw its income drop by 33 percent. Other DPAs whose incomes declined by double-digit percentages were the United Kingdom (down 28 percent), Slovenia (down 26 percent), Bulgaria (down 25 percent), Spain (down 24 percent), Canada (down 22 percent), and Australia (down 19 percent).
Amongst all DPAs whose incomes decreased over the five-year period, the average reduction was about 22 percent.
The 'Positive' News Second: Total DPA Staff Increased from 2011 to 2016
The average number of staff working at the DPAs surveyed by IAPP in 2011 was 69. According to the ICDPPC’s data, the average number of staff working at these DPAs was 97 in 2016. Thus, over the five-year period, DPAs seem to have added an average of about 28 full-time employees (FTEs), an increase in staff of about 41 percent.
Accounting for and excluding one outlier in the distribution — Mexico’s INAI, which added 461 staff over the five-year period — the average number of staff working at DPAs was 62 in 2011 and 75 in 2016. These figures indicate that DPAs (excluding Mexico’s) added an average of about 12 staff, a rise of nearly 20 percent, during the five-year period.
Which DPAs Gained Employees from 2011 to 2016?
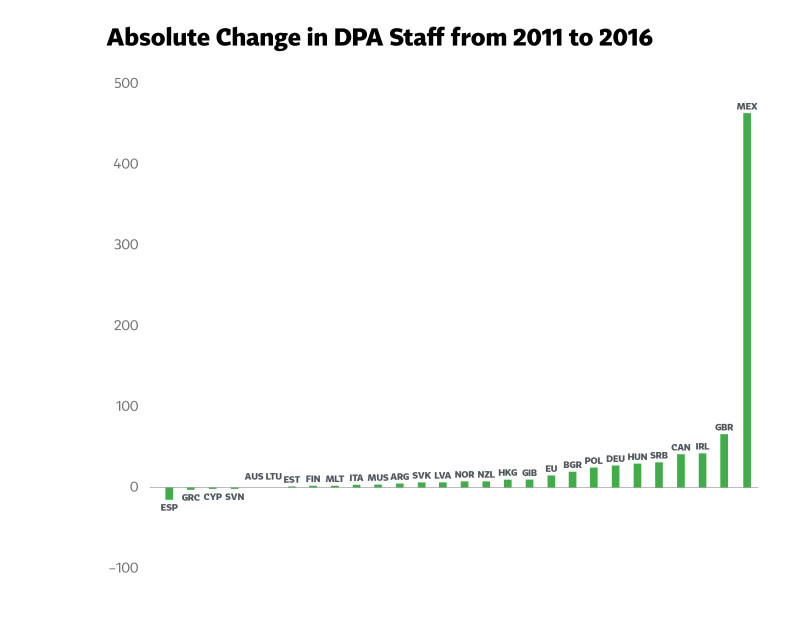
Twenty-two DPAs saw a net increase in their number of FTEs working for them from 2011 to 2016. On average, DPAs that added staff had 37 more FTEs on their payrolls. Excluding Mexico, they added 17 FTEs on average.
As noted above, in absolute terms, Mexico’s INAI made the greatest number of hires from 2011 to 2016; it added 461 FTEs to its payroll. The UK’s ICO was next, adding 65 staff during this period, followed by Ireland’s DPC, which added 42, and Canada’s OPC, which added 40. Other DPAs that added more than a dozen employees over the five-year period include: Serbia (31), Hungary (29), Germany (27), Poland (25), Bulgaria (20), and the EU (14).
Relatively speaking, however, Ireland and Mexico grew their staffs at the greatest rates by far. Ireland’s DPC went from 22 to 64 FTEs, which marked an increase of about 191 percent. DPA staff at Mexico’s INAI similarly grew, at 186 percent, increasing from 248 to 709 FTEs. DPAs whose staff sizes grew by more than 50 percent included Serbia (78 percent), Gibraltar (75 percent), and Hungary (66 percent). Latvia, Germany, Bulgaria, Canada, the EU, and Malta also each grew their staffs by a quarter to a third.
Which DPAs Cut Employees from 2011 to 2016?
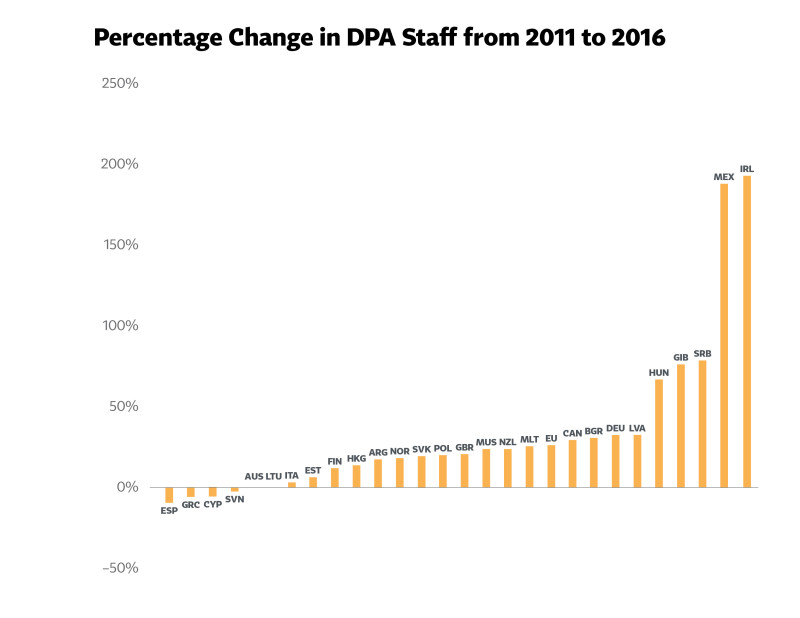
Out of the 28 DPAs included in the analysis of full-time staff, only four of them—Spain, Greece, Cyprus, and Slovenia—reported a decrease in the number of FTEs working for them. On average, they reduced their staffs by about 5 employees, or roughly 6 percent of their workforces. Meanwhile, two DPAs, Australia’s and Lithuania’s, reported no change in the number of FTEs over the five-year period.
Conclusion
The analysis presented above paints a nuanced portrait of how incomes and staff at DPAs around the world have grown and declined in recent years. The changes in income and staffing across all DPAs from 2011 to 2016, however, cannot be captured by any individual statistic or explained by any single trend. Rather, this analysis highlights that DPAs around the world confront unique opportunities and pressures regarding resource allocation.
To recapitulate, some DPAs have seen their incomes shrink while they have reduced the size of their staffs (i.e., Spain, Greece, Cyprus, and Slovenia). Yet, although the declines in income for these four DPAs have ranged from 44 percent (Cyprus) to 24 percent (Spain), the size of their staff reductions have been relatively modest (16 in Spain, but only three in Greece and one in both Cyprus and Slovenia). Australia also experienced an income cut, but kept the same number of FTEs across the five-year period.
Meanwhile, other DPAs have seen their incomes get smaller over the years, but have actually added FTEs: Italy, the U.K., Canada, Bulgaria, Serbia, Finland, and Estonia are included in this group. DPAs in the U.K. and Canada stand out for having experienced some of the largest percentage declines in income—down 28 percent and 22 percent, respectively—while growing their staffs at some of the highest rates—up 20 percent and 28 percent, respectively. Serbia is also notable for having experienced a minor income cut, 3 percent, but growing its staff by 78 percent.
The most typical story of a DPA over the past five years is perhaps the following: Seeing a modest rise in income combined with a modest rise in staff. Fourteen DPAs increased by staff and budget: Mauritius, Malta, Latvia, Slovakia, Poland, Hungary, Gibraltar, Norway, New Zealand, the European Union, Hong Kong, Germany, Ireland, and Mexico. No DPA that saw an increase in its income reduced its number of FTEs. Lastly, Lithuania saw a slight income rise, but added no additional FTEs from 2011 to 2016.
The data used in this analysis came from theIAPP’s Data Protection Authorities 2011 Global Surveyand theICDPCC’s Census 2017. Only DPAs that responded to both surveys were included in this analysis. The similarity in question wording allows for a valid comparison of these measures across time. On the IAPP’s 2011 Global Survey, respondents were asked, “Please enter the number of full-time staff in your office.” The corresponding questions on the ICDPPC’s 2017 survey were, “How many staff are employed by the authority (full time equivalent employees)?” Another question on the 2011 survey asked, “What is the annual budget of your office (Please specify currency)?” The corresponding 2017 survey question was: “What was your total income for 2016 in your national currency?” Malta did not report its number of staff in 2011, but reported 10 staff in 2016. Argentina did not report its income in 2011, but reported an income of $562,035 in 2016. The smaller subset of DPAs used in this study tended to have higher incomes and employ more staff than the average ICDPPC member. Thus, any trends noted or inferences drawn from the data presented here may not be valid for all ICDPPC members. It is also important to note that none of the 2011 DPA incomes reported here were adjusted for inflation. Given that theannual rates of inflation globallyover this five-year period were mostly between3 and 5 percent, increases in income less than this amount likely do not indicate a substantial increase. Adjusting for inflation would also be likely to amplify the magnitude of the declines in income experienced over this five-year period.
Acknowledgement: The IAPP would like to thank the International Conference of Data Protection and Privacy Commissioners (ICDPPC) for sharing the data on which this analysis was based.